The balanced scorecard model is a strategic performance management tool used by management teams to set and measure performance in a way that is aligned with the vision and strategy of the organization.
Why Use a Balanced Scorecard?
There are several reasons why you might want to use a balanced scorecard. A balanced scorecard allows to:
- Monitor and communicate progress towards your strategic targets.
- Link everyone’s day-to-day work to the strategy and vision.
- Prioritize your projects, products, and services.
- Increase financial health, increase customer satisfaction, improve efficiency, and increase knowledge and innovation within your organization.
History
Robert S. Kaplan and David P. Norton developed the balanced scorecard concept. Kaplan (born 1940) was an accounting academic and Emeritus Professor of Leadership Development at Harvard Business School. Norton (born 1941) was a business theorist and management consultant.
Together, they first described the balanced scorecard in their 1992 Harvard Business Review paper, “The Balanced Scorecard – Measures That Drive Performance.”
How to Use A Balanced Scorecard
The balanced scorecard involves measuring the performance of a business from four perspectives, all linked to the vision and strategy of the organization.
The characteristics of balanced scorecards include that they’re:
- Balanced: meaning they consider both financial and non-financial performance measures equally important.
- A scorecard: allowing you to track how you’re doing.
- High-level: enabling you to see your most important performance measures.
- Long-term: meaning they link performance targets to the long-term vision and strategy of the business.
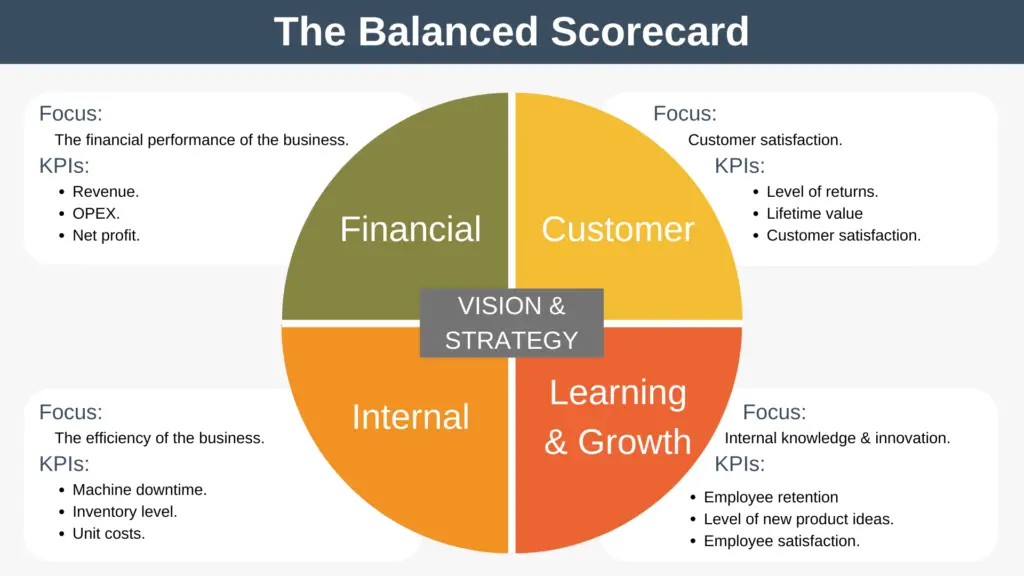
At the heart of the balanced scorecard are the vision and strategy of your business. These define your vision for where you want the business to get to over the long term and your strategy to achieve that vision. You can’t create a balanced scorecard until you have these cornerstones in place.
In addition to vision and strategy, the balanced scorecard is broken down into four areas for improvement, known in the model as the four perspectives. These are:
- Financial perspective.
- Customer perspective.
- Internal perspective.
- Learning and growth perspective.
Your balanced scorecard should also contain what you consider to be the most important key performance indicators (KPIs) for each perspective.
Let’s take a look at each perspective in more detail.
1. Financial Perspective
The focus of this perspective is the financial performance of the organization. Commonly used KPIs for this perspective are:
- Revenue: How much revenue do you generate over the period (daily, monthly, or annually)?
- OPEX: Your OPerational EXpendaturs, or in other words, how much you spend running the business.
- Net profit: How much profit do you generate after subtracting all costs?
2. Customer Perspective
The focus of this perspective is customer satisfaction. Commonly used KPIs for this perspective are:
- Level of returns: What percentage of goods you ship do customers return?
- Lifetime value: What is the average revenue a customer will generate over their lifespan as a customer?
- Customer satisfaction: A measure of how happy your customers are with your products and services.
3. Internal Perspective
The focus of the internal perspective is the efficiency of the business; in other words, how much time, money, or resources are needed to run your business. Commonly used KPIs for this perspective are:
- Machine downtime: How many minutes is critical machinery not running over a set period?
- Inventory level: How much merchandise do you hold on average?
- Unit costs: The total amount you spend to produce, store, and sell one unit of whatever it is that your business sells.
4. Learning and Growth Perspective
This perspective focuses on maintaining and growing your internal knowledge and innovation. Commonly used KPIs for this perspective are:
- Employee retention: what percentage of employees leave each year?
- Level of new product ideas: How many new ideas do you generate over time?
- Employee satisfaction: How happy your employees are working for your organization.
Balanced Scorecard Example
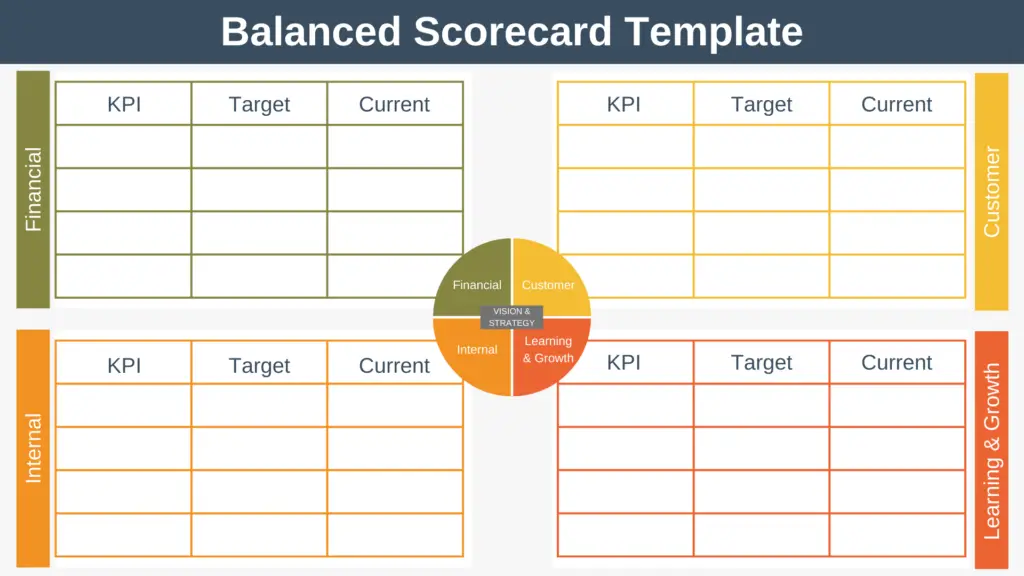
In the image below, you can see a balanced scorecard example. We won’t dwell for long on this example, as this balanced scorecard format isn’t the most popular type in use today. We’ll look at the most popular format shortly.
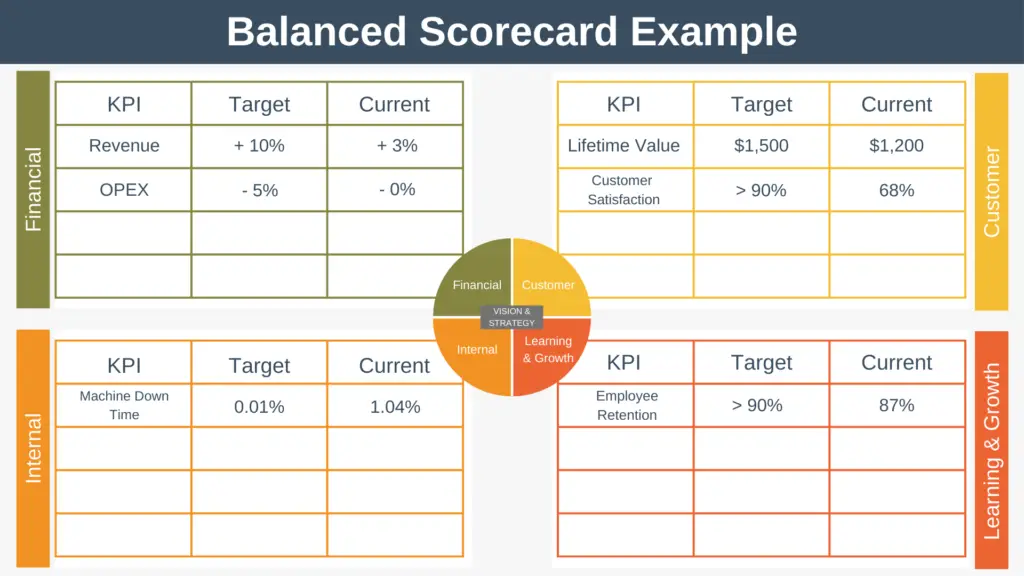
The key thing to take away from this example is:
- Not only have KPIs been defined for each perspective, but targets have been set, and current performance is being tracked against that target.
Balanced Scorecard Template
If you’d like to download the Balanced Scorecard Template on which this example is based, then you can do so here [LINK].
Balanced Scorecard Strategy Map
A more modern way of creating a balanced scorecard, which goes by the name of a strategy map, is shown below. Even though this introduces a few new concepts, it should be easier to use than the example we’ve just looked at.
Why? Because instead of plucking your KPIs from thin air, you’re linking them directly to your strategy.
For this example, imagine that you run a company that sells furniture online. An example strategy map for such a company might look something like this.
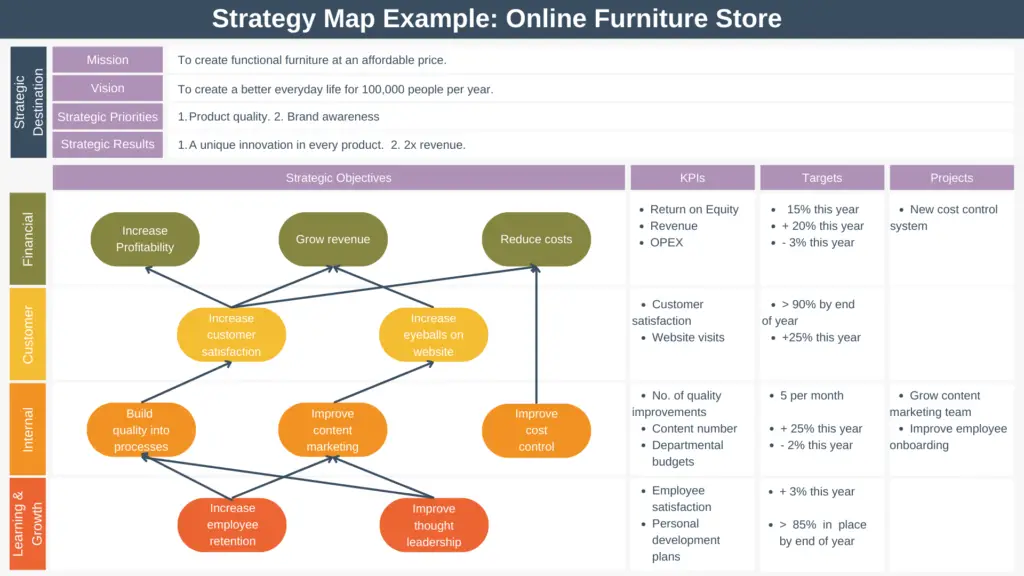
Let’s examine where this strategy map differs from the balanced scorecard we’ve already discussed.
1. Strategic Destination
First, we have a Strategy section at the top of the Strategy Map. This section starts broad with the Mission statement and gets more specific with each section, finishing with strategic results. You can think of each section as follows:
Mission
A statement defining what you want to do, who you want to serve, and how you want to serve them. In this example, you want to create functional furniture at an affordable price.
Vision
A statement detailing where you aspire to be. In this case, you want to create a better everyday life for 100,000 people yearly.
Strategic Priorities
The most important things your organization should focus on over a specific period of time, usually three to five years. It’s important to limit the number of strategic priorities you define. If you don’t, then not only will your strategy map get very complicated, but your strategy will be less focused. In this example, you have two priorities. First, to improve the quality of your products and second, to increase brand awareness.
Strategic Results
The desired end state at the end of the period of time. In this case, you want every product you make to contain some kind of unique innovation, and you want to double your revenue.
2. Linked Strategic Objectives
In this section, the idea is to select a few strategic objectives for each perspective based on your strategy. Once you’ve chosen your objectives, the next step is to link them to show cause and effect.
In the example, you can see that increased profitability happens if you can increase customer satisfaction, which will happen if you can effectively build quality into your processes. Finally, building quality into your processes will be enabled if you increase your employee retention and improve your thought leadership.
The benefit of doing this is that it brings sharpness and focus to your strategy and makes it easy for you to select your KPIs and your KPI targets. When choosing your KPIs, select one KPI for each strategic objective you’re trying to achieve, and then set a target for it.
3. Projects
Your KPIs aren’t going to improve on their own, so the Projects section allows you to list the initiatives and projects that you hope will move the needle of your KPIs.
Strategy Map Template
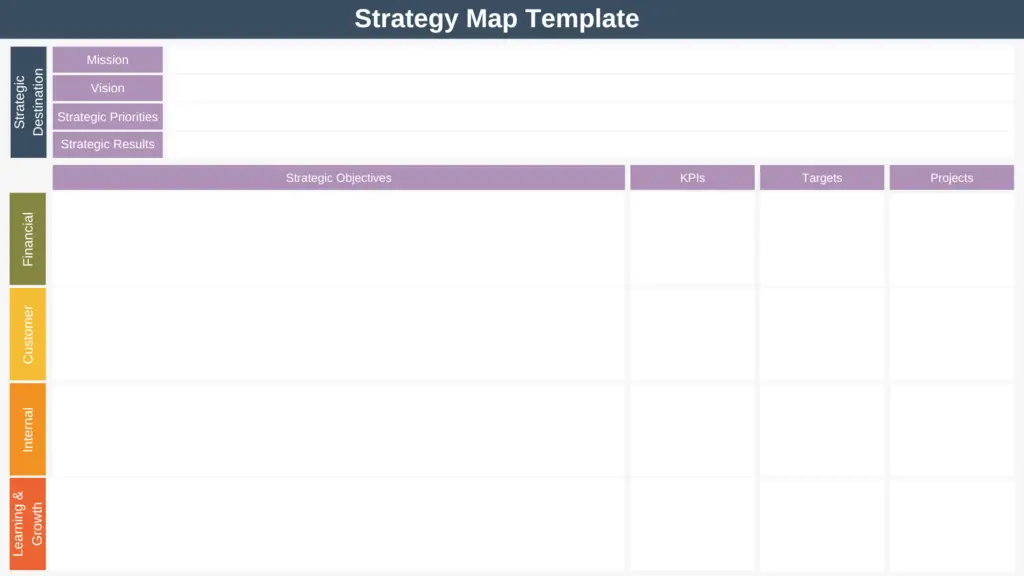
If you’d like to create your own strategy map, you can use our Strategy Map Template PDF, which is available to download here.
Cascading Strategy Map
Your strategy map lays out your strategy and how you will make it happen. Now you can take it and cascade it through your organization.
That means that each functional unit within the organization takes the organizational strategy map and creates its own functional unit strategy map that shows how the functional unit contributes to the organizational strategy.
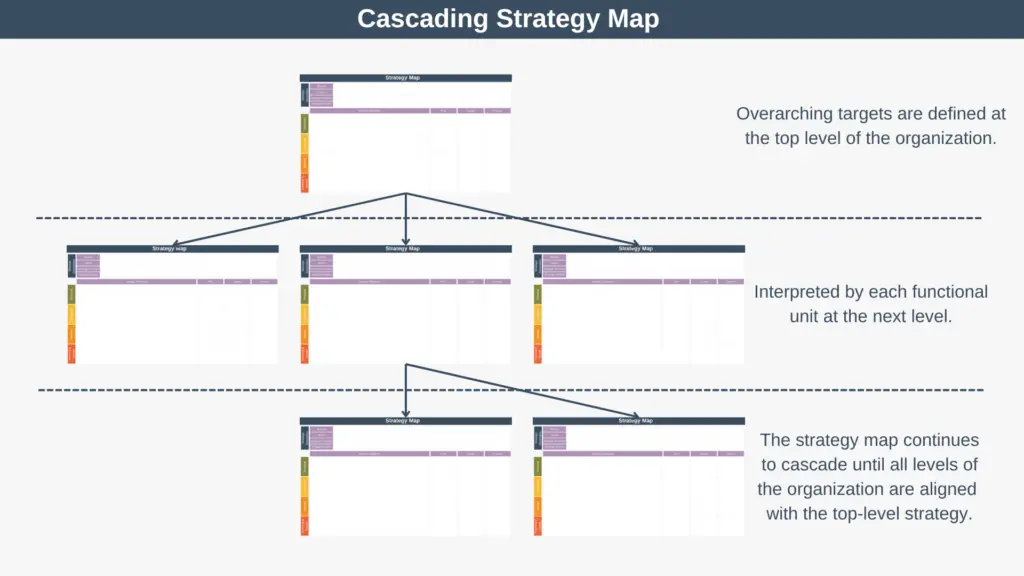
You repeat this process until the strategy map has cascaded down the entire chain of the organization. As the strategy cascades down the organization, objectives and KPIs become increasingly operational.
The ultimate aim of cascading is twofold:
- To ensure that every employee knows exactly how their work contributes to the organizational strategy.
- To align every employee within the organization to the strategy.
Advantages & Disadvantages
There are several advantages and disadvantages associated with balanced scorecards.
Advantages
- Essential strategic information is contained in a single place rather than spread around several documents and systems.
- They align every employee with the organization’s strategy.
- They ensure that your strategy is balanced across the four perspectives.
- They make communicating your strategy and measuring progress towards achieving your strategy easier.
Disadvantages
- Creating a balanced scorecard and cascading it through your organization can take a lot of time.
- Every organization is unique and so each balanced scorecard must be tailored to each organization.
- If you try to do too much, balanced scorecards and strategy maps can get complicated very quickly.
Summary
The strategy map and the balanced scorecard can help you to set and measure performance in a way that is aligned with your strategy.
The strength of the models is that they ensure a balanced approach to creating KPIs and then allow you to align everyone within your organization to those objectives.
