The GE McKinsey Matrix, also know as the McKinsey Nine Box Matrix is a strategic tool used for business portfolio planning.
A business portfolio is a group of businesses that collectively make up a company. These individual businesses are often referred to as strategic business units (SBUs).
As an example of a business portfolio, consider Hilton Hotels. The Hilton Hotels group is made up of many SBUs including Hilton Double Tree, Hilton, Conrad Hotels, and Waldorf Astoria Hotels.
Some businesses can be very complex, even having over one hundred SBUs. In addition, no business has an infinite amount of resources to invest. The GE McKinsey Matrix allows a business to analyze their portfolio of SBUs to determine:
- Which SBUs should receive more or less investment.
- What new products or SBUs are needed in the business portfolio.
- Which products or SBUs should be divested.
The GE McKinsey Matrix came about in the 1970s when GE hired McKinsey & Company to develop a business portfolio analysis tool. They wanted this tool to enable them to better analyze their SBUs so they could make better investment decisions.
An example GE McKinsey Matrix is shown below:
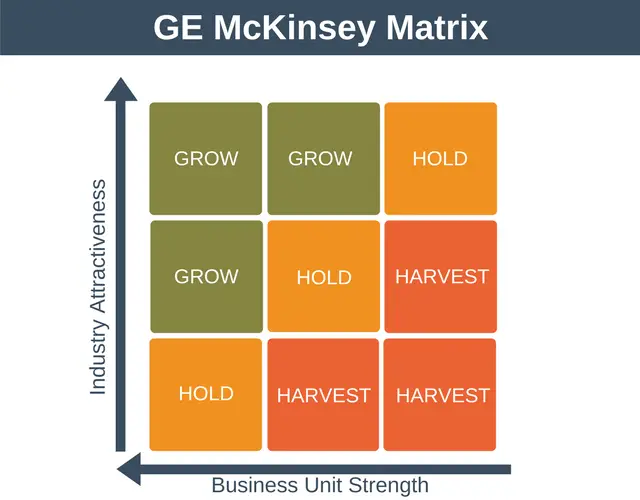
In the GE McKinsey Matrix, the attractiveness of a market is represented on the y-axis. Whereas the competitive strength of the business unit (SBU) is shown on the x-axis.
Important
It’s easy to overlook, but the direction of the arrows in the diagram is important. Note the industry attractiveness increases as you go from the bottom of the diagram to the top, but that business unit strength decreases as you move from left to right.
Outputs from the Matrix
Once the SBUs have been plotted onto the matrix we can create investment strategies based on where the SBU appears within the matrix:
Broadly speaking, there are three options available for each strategic business unit:
- Grow: invest in this businesses.
- Hold: the potential of this businesses isn’t obvious. That’s not to say investments won’t be made in this business. However, no investment should be made in this business until after investment in the “grow” SBUs has been confirmed.
- Harvest: invest just enough in this business to keep it operating or divest.
The diagram above provides a very simplistic breakdown of the options available. A more detailed breakdown is shown in the diagram below:
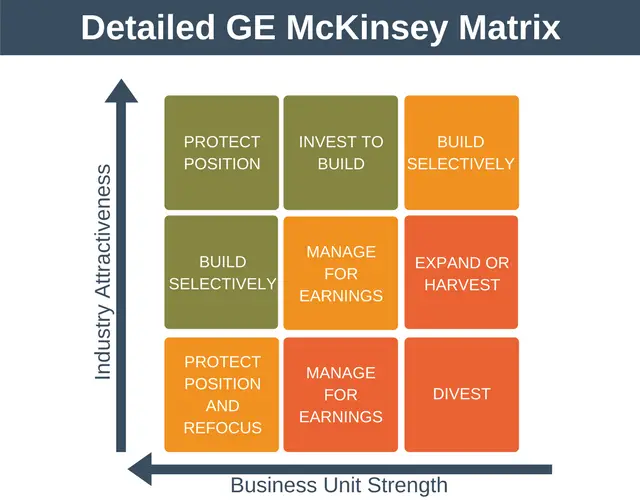
Here is an explanation of what each option means:
- Protect Position: Invest to protect the market position and grow rapidly.
- Invest to Build: Invest to strengthen market position by building on strengths. Manage areas of vulnerability.
- Build Selectively: Specialize around a potentially limited set of strengths to enhance the ability to combat competition. Withdraw from the market if sustainable growth or competitive advantage is not possible.
- Manage for Earnings: Invest within these SBUs in those areas where the earnings are good and the risks reasonably low. Upgrade the most profitable product lines to maintain profits.
- Expand or Harvest: Expand only if this can be done with minimal investment. Otherwise, harvest the investment by streamlining operations.
- Protect Position and Refocus: Determine if the business can be refocused so the current strengths of the business are moved to a new market segment.
- Divest: Cut costs and avoid investment immediately. Sell to realize a cash value for the business.
Factors that Affect Market Attractiveness
Assessing market attractiveness is in many ways subjective in nature. Despite this, there are many factors which can be ranked to help us determine market attractiveness, including:
- Market size
- Expected market growth rate
- Market profitability trend
- Pricing trends
- Competition level
- Ability to differentiate
- Demand variability
Factors that Affect Competitive Strength
Competitive strength considers whether the SBU has a material competitive advantage over competitors. Again, this is somewhat of an objective measurement. Factors to score to better determine competitive strength include:
- Total market share
- Market share growth relative to competitors
- Customer loyalty
- Relative brand strength, brand recognition
- Cost structure compared to competitors
- Distribution strength and production capacity
- Management strength
GE McKinsey Matrix vs. BCG Matrix
One of the best-known portfolio tools is the BCG Matrix. The BCG Matrix was developed by the Boston Consulting Group.
Whilst the GE McKinsey Matrix is more complex, it overcomes some of the disadvantages of the BCG Matrix, including:
- Market attractiveness considers a much broader range of factors than just market growth rate.
- Competitive strength is a more robust metric on which to base decisions than market share alone.
How to Use the Model
Using the model effectively can be a costly and time-consuming undertaking. Here is a simple 5 step process you can follow to get you started:
1. Determine the industry attractiveness of each SBU
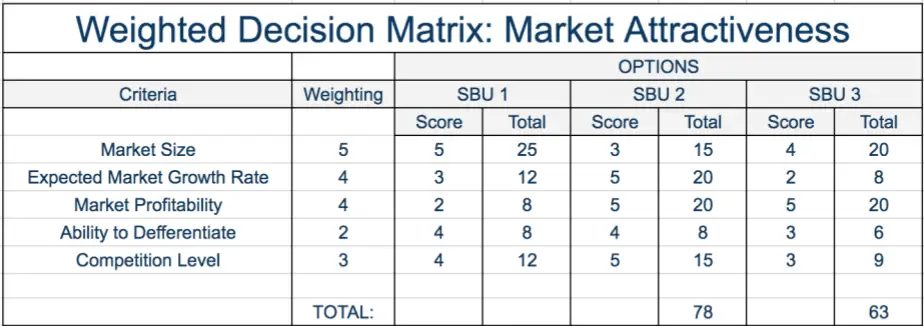
Do this by scoring each of the factors that affect market attractiveness in a weighted decision matrix.
An example of a weighted decision matrix for market attractiveness factors is shown below:
2. Determine the competitive strength of each SBU
Again, score each of the factors using a weighted decision matrix.
The output from steps one and two won’t give you meaningful numbers. But these numbers will allow you to compare the relative strength of one business unit to another.
3. Plot the information on the GE McKinsey Matrix
The next step is to plot each of the business units onto the matrix. In the example below, we have five SBUs plotted on the matrix.
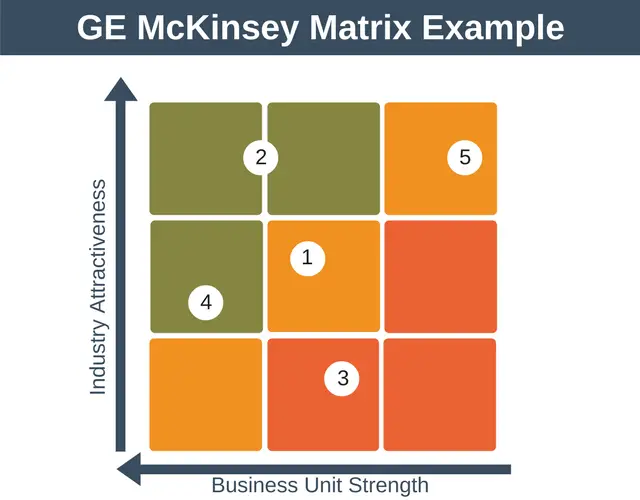
As you can see, two businesses appear to be candidates for investment (2 & 4). Two businesses are candidates to hold (1 & 5). One business is a candidate to hold or potentially divest (3).
4. Identify the future direction of each SBU
The matrix as created above only provides a snapshot of where each business is right now. Whilst that is useful, business doesn’t operate in a vacuum and things are changing all of the time. Because of this, we can make better decisions if we understand where each business is going to be in the future.
To represent where each business is going we simply use an arrow as shown in the diagram below.
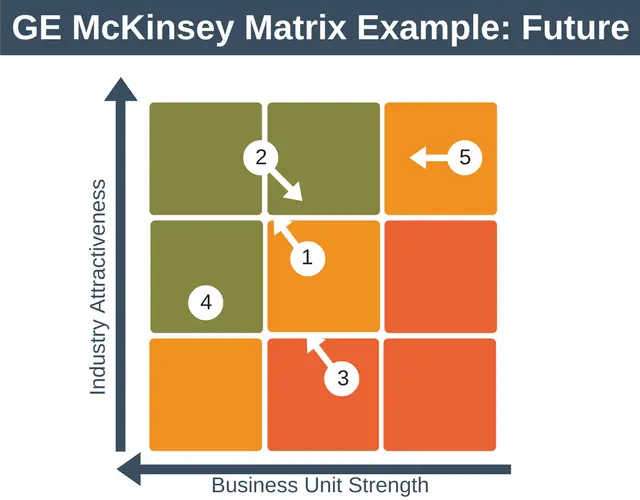
This example is saying that we expect each SBU to change as follows:
- SBU 1: We expect the industry to become more attractive and the competitive strength of this SBU to improve.
- SBU 2: We expect the industry to become less attractive and the competitive position of this SBU to decline over time.
- SBU 3: We expect the industry to become more attractive and the competitive strength of this SBU to improve.
- SBU 4: We expect the industry attractiveness and competitive strength to remain broadly the same.
- SBU 5: We expect the industry to remain as attractive as it is currently, but we expect the business unit strength to improve.
5. Choose where to invest
The final step is to choose which businesses to invest in.
Look again at our example. At first, it appeared as though business 2 was one to invest it. But, looking at the expected future position, you can see we expect the attractiveness of this industry to reduce significantly over time. Our competitive position is also expected to shrink over time. Because of this, the business moves from one in which to invest to one to consider harvesting.
The matrix makes it clear that some SBUs warrant investment more than others, but that doesn’t necessarily mean that’s where money should be invested.
There are many reasons for this. It could be that one business doesn’t need much capital investment to grow. Conversely, another business may require a very large investment. Nor does the diagram tell you how much to invest, or in which area of an SBU to invest (marketing, R&D etc). Further analysis will be needed to answer these questions.
Summary
Many businesses have multiple strategic business units (SBUs) all competing for investment. In this situation, it can be difficult for an organization to decide where to invest its limited resources.
The GE McKinsey Matrix provides a structured means to help organizations understand where to make strategic investments.
It works by plotting both industry attractiveness and marketing competitiveness for each SBU. This mapping is done not only for the current situation of the business but also for where the business expects to be in the future.
This information about current and future business attractiveness can then be used as an input to making investment decisions.
