Note at this article has been superseded by a newer article explaining everything you need to know about Value Chain Analysis.
In this article we’ll examine examples of how you can perform a firm level value chain analysis. The Value Chain was first introduced by Michael Porter during the 1980’s in his bestselling book, Competitive Advantage: Creating and Sustaining Superior Performance. In addition to examining value chains from a firm level, it is also possible to examine them at an activities level. We will only cover firm level value chains in this article.
Value Chain Definition
Value Chain analysis is premised on the belief that competitive advantage can only be understood by looking at the firm as a whole. Competitive advantage and marketplace differentiation can be found, according to Porter, by examining the chain of activities a firm undertakes to deliver value to its customers.
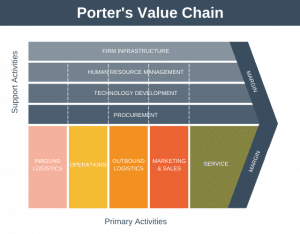
The most commonly used graphic to represent a firms value chain is shown below:
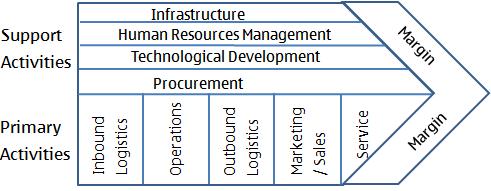
As you can see from the diagram the value chain is created at the business unit level. You can gain some appreciation of how a business works at the top level by examining this value chain. Products pass through the value chain from left to right, and with each activity performed, the product gains some value.
Again, as you can see from the diagram, our generic business consists of support activities such as Infrastructure, Human Resources Management, Technology development, and Procurement. It also consists of primary activities such as Inbound Logistics, Operations, Outbound Logistics, Marketing and Sales, and Service. The total cost of all these described activities combined in relation to the cost charged to the customer will determine the profit margin, or lack thereof.
We provide some examples of how to use the Value Chain model below, but if you’ like further detail check out Michael E. Porter’s excellent book, Competitive Advantage: Creating and Sustaining Superior Performance.
Value Chain Examples
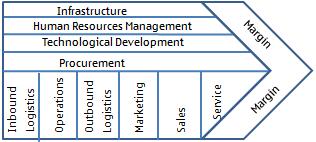
At a firm level the value chain can be used in a number of ways. The most basic of which is simply to describe visually the company or a competitor. This is done by simply adapting the generic model to suit your company. In the example below marketing and sales have been separated into different distinct business units, perhaps because these represent such large business units in this particular business:
Another way to use the diagram is to quickly see the company’s strengths or weaknesses. In the example below, strengths are highlighted in blue, with this particular business being strong in Technological Development and Marketing/Sales:
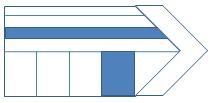
Whilst this might appear simplistic it is useful when you want to compare the strengths and weaknesses of your organization with another, to understand how this impacts disparities in differentiation and margin between the two businesses.
The final way to use the diagram is as a quick way to identify a potential partner for strategic alliances, mergers, or even an acquisition. In the diagram below two companies are compared according to their strengths:
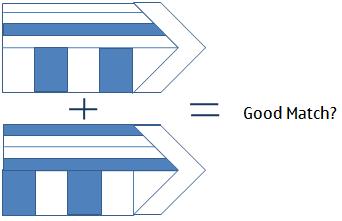
In the example above it appears, at least at the top level, as though the two companies being compared would be a good match. This is because each businesses individual strengths complements nicely the others. Of course, in the real world things are rarely this clear cut, but the idea is still very applicable for gaining a quick appreciation of how two similar businesses might align.
Summary
The value chain can be used to understand differentiation in a graphical way at a firm level. These graphics can then be used to visualize a company, highlight strengths or weaknesses, compare strengths or weaknesses, or identify matches for strategic partnerships. This latter example is particularly important to understand if you’re a program manager responsible for M&A activities – the Value Chain fit will act as a constant memory aid guiding your decisions when running and structuring the program of work.

