The BCG Matrix (aka Boston Matrix) is a popular tool which can help a business analyze its portfolio.
In a business sense, a portfolio simply means the range of products sold by a business.
No business has an infinite supply of money to invest. So, when a business has a portfolio of products it must decide how to allocate investment, such as marketing budget or R&D resource, to that portfolio. The Boston Matrix is a tool which can help in making these decisions.
Note
The BCG Matrix was created for the Boston Consulting Group by Bruce Henderson in 1968.
In this article, we analyze products, but the BCG Matrix can also be used to evaluate individual business units (called Strategic Business Units (SBUs)) or any other cash-generating assets, such as property.
The BCG Matrix works on the principle that every company should have a portfolio containing both high-growth products requiring cash investment and low-growth products that throw off excess cash. Having both types of products will ensure long-term business success.
What is the BCG Matrix?
The BCG Matrix is a simple grid with Market Growth Rate on one axis, and Relative Market Share on the other.
- Market growth rate: Is the market in which the product is being sold growing quickly, slowly, or not at all?
- Relative market share: Does the product have a high or a low share of the current market?
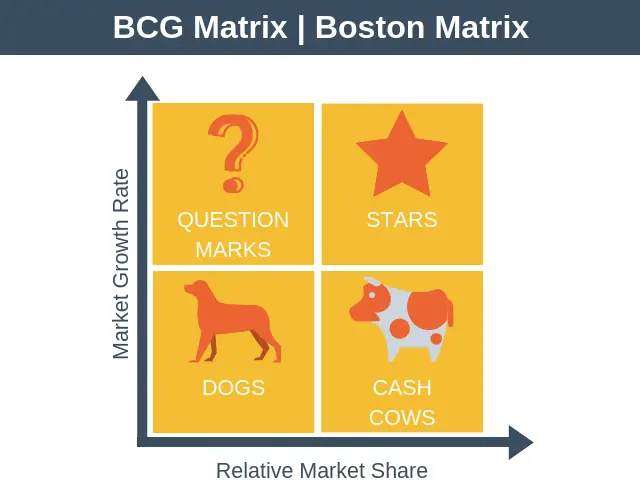
Each product in a business will be assessed against both of these criteria and then placed into the matrix. This will result in each product of the portfolio falling into one of four categories:
1. Cash Cows
These are products with a high-market-share in a slow-growing market. They are profitable, generating good margins, and throwing off excess cash without the need for significant investment. Cash Cows need to be milked for profits but given minimum investment. In a nutshell, we want to milk these products without killing the cow!
2. Stars
These are products with a high-market-share in a growth market. These stars have the potential to provide a high proportion of the future profits of the business. It is thus advisable for a business to invest in these products to maintain market leadership, thus securing future profits as the market continues to grow.
3. Dogs
These are products with a low market share in low-growth markets. If these products are not profitable you may wish to divest them or consider a red ocean strategy. If a dog is profitable you should invest as little as possible into it, or even consider divesting it.
4. Question Marks
These are products with a low market share in a high-growth market. Because of this their growth-rate going forward is unclear and further investigation is needed to decide what to do with these products. These products might become stars, but equally, they might crash and burn as it’s not easy to spot a future star.
Boston Matrix Example
The BCG Matrix is a strategic tool to provide an initial screen of a businesses opportunities. By then determining a strategy for each individual product of either hold, divest, harvest, or build, the portfolio mix of a business can be maintained in a profitable combination, for the long-term.
For our example, we’re going to analyze Apple’s product portfolio. You can see this portfolio mapped onto a Boston Matrix in the diagram below.
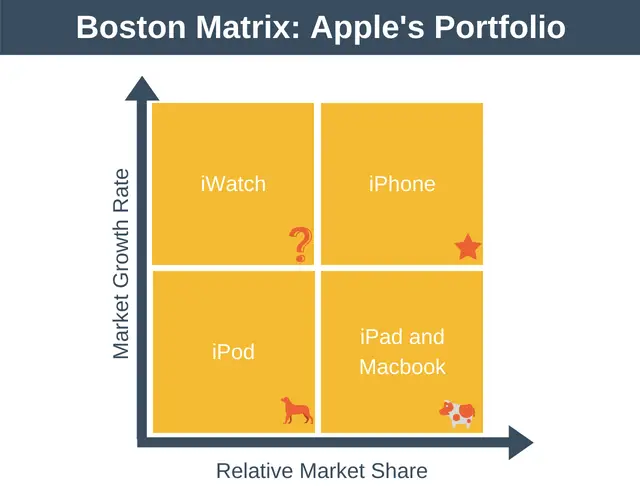
From this diagram we can see:
- Stars: The iPhone is the star of Apple’s portfolio. It’s has a high market share in a market that is still growing. The iPhone generates significant profit but still requires investment to transition to into tomorrow’s cash cow.
- Cash Cows: The iPad and MacBook are the cash cows of Apple’s product portfolio. These products have a high market share but the market for these products isn’t really growing anymore. They require relatively little investment for them to continue to be profitable.
- Dogs: The iPod is the dog of the portfolio. The market isn’t growing as people tend to use their phones to listen to music and podcasts these days. This change in consumer behavior results in a shrinking market share. Thus, doesn’t make sense to invest into the iPod.
- Question Marks: The iWatch is the one product in Apple’s portfolio with a question mark hanging over it. It certainly has the potential to become as big a market as the phone market, but there are still many unknowns. Apple will need to analyze the iWatch against its other up and coming products to decide where to invest for the future.
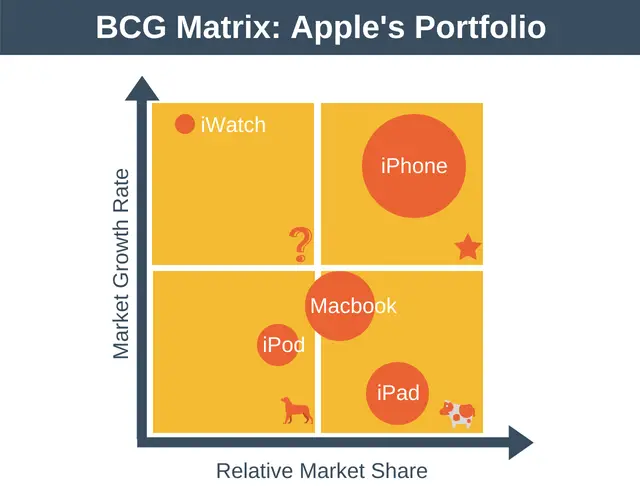
One final note on plotting your BCG Matrix in practice. In the example below, the area of the circle in the diagram represents the value of sales for a product. This is particularly useful as it allows you to visualize your company’s strengths and weaknesses in terms of cash-flows.
Boston Matrix and Product Lifecycle
The BCG Matrix is actually based on the product lifecycle as you can see in the diagram below.
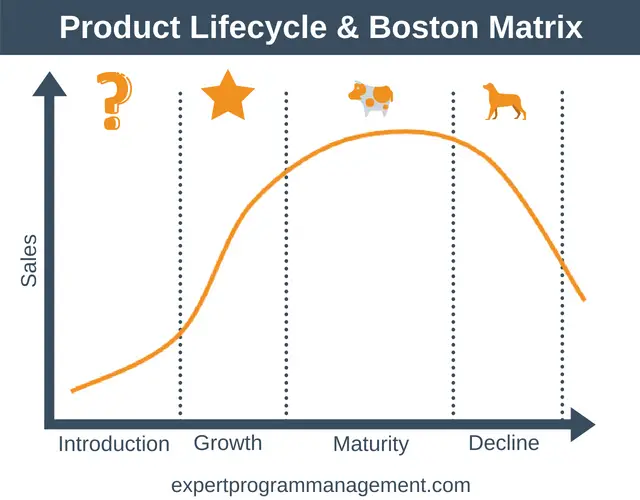
Interpreting this diagram we can see that most products will start life as question marks.
Those question mark products that become successful, that is, those products that can maintain their category leadership as their market grows, will turn into stars.
Eventually, as market growth slows they turn into cash cows. These cash cows generate high profits and require little in the way of investment.
Towards the end of the product’s life, the cash cow becomes a dog as sales growth stops completely or starts to decline.
BCG Matrix Advantages
The advantages of the Boston Matrix include:
- It provides a high-level way to see the opportunities for each product in your portfolio.
- It enables you to think about how to allocate your limited resources to the portfolio so that profit is maximized over the long-term.
- It shows if your portfolio is balanced. For example, if you have too few products in your portfolio then you could be in the dangerous position of having all your eggs in one basket.
- The tool is very simple to use and understand.
BCG Matrix Disadvantages
The disadvantages of the Boston Matrix include:
- Market growth rate is not an accurate measure of a market’s attractiveness to a business.
- Market share doesn’t actually predict how much cash a product generates. For example, dogs can be profitable, and stars can have a high market share and high growth but be operating in an extremely low margin industry and therefore never be particularly profitable.
- It does not account for external factors, known as environmental factors. These factors include such things as the emergence of new technologies or potential changes in tax laws. To analyze external factors you can use a PEST Analysis.
- It is only a snapshot of the current situation. It doesn’t look to see what is likely to happen to a market in the future. A McKinsey Matrix is a better tool to use to analyze your portfolio if you’re looking to understand what’s likely to happen in the future.
Summary
The BCG Matrix is a method of examining a portfolio of products by relative market share and relative market growth.
This results in the portfolio broken down into stars, cash cows, dogs, and question marks.
The information within the matrix can then be used to create the right portfolio mix (or a balanced portfolio).
In other words, the portfolio should have enough stars to secure the future high-growth of the organization. It should have enough cash-cows to supply the funding for this future growth, and it should have enough question marks in the portfolio with the potential to be turned into future stars.
