Break-even analysis allows you to understand at what point your sales of a product or service will cover your costs. This point, when your sales cover your cost of doing business is known as your break-even point (BEP).
At break-even point, you aren’t making a profit, but you’re not incurring a loss either.
Break-even analysis is an essential calculation for new businesses. Why? Because all new businesses will want to understand when they can expect to be profitable.
Break-Even Analysis Graph
You can graphically represent a break-even analysis by using a break-even chart. The break-even analysis chart tells us the different costs incurred at various sales levels.
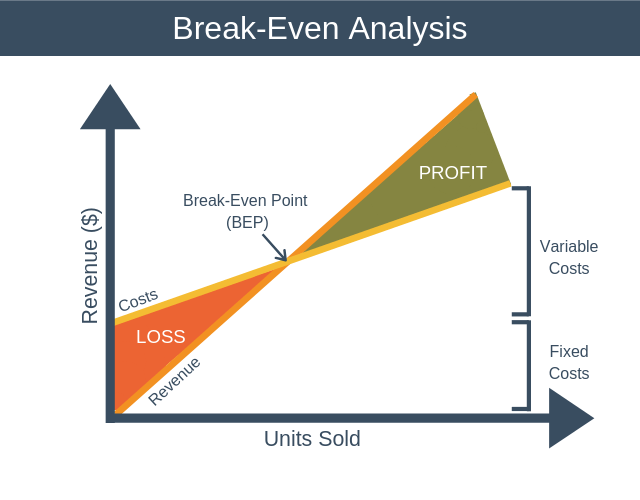
You can interpret the break-even analysis chart as follows:
- The X-axis shows the number of units sold.
- The Y-axis shows the sales revenue generated in dollars.
- The Income line shows the amount of revenue generated in dollars as an increasing number of units is sold.
- The Costs line shows how the costs incurred by the business change as a growing number of units is sold.
- When you sell a low number of units, your costs are higher than your revenue, and you’re making a loss (shaded red in the diagram).
- At the point where revenue and costs intersect on the diagram, BEP, total costs are the same as revenue, and you are neither making a profit or a loss.
- When you sell a high number of units, your costs become less than your revenue, and you’re making a profit (shaded green in the diagram).
From the diagram, you can see that costs don’t start from zero. These are your fixed costs. As soon as you make your first sale your costs begin to increase (fixed costs + variable cost of selling one unit).
As more units are sold your costs continue to climb. However, as you sell more units, your costs don’t climb at as steep a rate as your revenue. Eventually, you reach the break-even point (BEP). Here your total costs are the same as your total revenue.
As even more units are sold you move into profit, where revenue exceeds all costs.
Types of Cost
There are two types of costs to consider when performing a break-even analysis. These are fixed costs and variable costs.
1. Fixed Costs
Fixed costs are costs that remain the same regardless of how many units you sell. You have to spend this money before you can sell your first unit.
Examples of fixed costs include:
- Rent.
- Insurance.
- Administrative costs.
- Property taxes.
- Salaries.
Your fixed costs will typically stay the same over the short-term. They may, however, change over the long term. For example, if your business is successful and you decide to move to a bigger office and hire more people, then your rent and salary bill will increase.
2. Variable Costs
Variables costs are costs that change directly in proportion to how many units you make.
Examples of variable costs include:
- Raw materials.
- Packaging.
- Commission.
- Delivery costs.
- Piece labor rate.
Break-Even Point Formula
When you conduct a break-even analysis, the first thing that you’ll want to do is compute your break-even point. To calculate the BEP, you use the following formula.
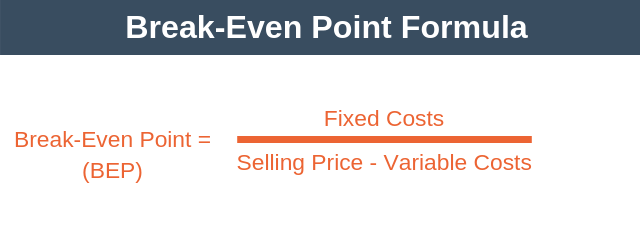
Before we look at an example, let’s take a look at the bottom line of the equation, selling price minus variable costs. This part of the calculation has a name, contribution margin. Thus, you can write the break-even point equation as follows:
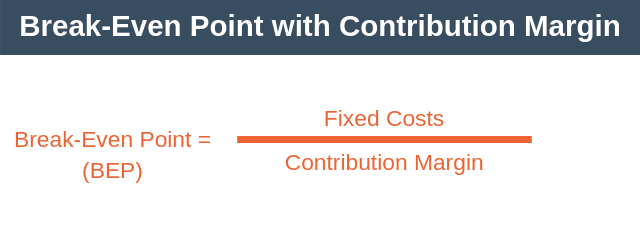
You can think of contribution margin as being the amount each unit contributes towards firstly covering fixed costs, and then later growing profits.
Break-even Analysis Example
Imagine that you want to launch a new business selling a smartphone app. You make the following assumptions about your costs and revenue.
- Expected average selling price = $5.
- Estimated fixed costs = $75,000 (this is enough to cover your salary and pay for a small office). These costs will not change with the number of apps sold.
- Variable costs = $0.25 (these are the transaction fees you need to pay on each sale).
Armed with this information, we can calculate break-even point as follows:
- BEP = $75,000 / ($5 – $0.25)
Thus, rounding up to the nearest unit, you’d need to sell 15,790 units of your app to break even.
Using the Model
The model isn’t only used to calculate the break-even point as shown above. It can also be used to estimate the impact on your profitability of:
- Making a price change.
- Changing fixed costs.
- Changing variable costs.
Impact of a Price Change?
What if you sold your app for $12 instead of $5. In this instance, you’d need to sell 6,386 copies of the app to break even.
- BEP = $75,000 / ($12 – $0.25) = 6,383 units
That’s still a large number of units, so what if you sold the app for $3 per month and expected people to stay customers for an average of one year. In this case, you’d need to sell just 2,098 copies of your app to break even.
- BEP = $75,000 / (($3 * 12) – $0.25) = 2,098 units
This is the real benefit of break-even analysis. It allows us to run through several scenarios to help you understand what price will work best for you.
Impact of Changing Fixed Costs?
Suppose you wanted to allocate some money to marketing. You decide to spend $1,000 per month on influencer marketing. This spending adds $12,000 ($1,000 * 12) to your fixed costs.
Building on our previous example, you’ll need to sell 2,434 copies of the app per year to break-even.
- BEP = ($75,000 + $12,000) / (($3 * 12) – $0.25) = 2,434 units
Impact of Changing Variable Costs?
Suppose that you want to send a personal thank you card by mail to everyone who purchases the app. We can adjust our break-even analysis to understand how this will impact our profitability.
You estimate that the card will increase your variable costs to $1 per copy of the app sold. This now means that you need to sell 2,504 copies of the app to break even.
- BEP = $87,000 / ($36 – $1.25) = 2,504
Break-Even Analysis Summary
Break-even analysis allows us to analyze how many units of a product or service you need to sell to break-even.
The real power of the model is how it allows you to scenario plan your profitability based on changes to selling price and costs. In particular, it’s a useful tool to use when setting the price of a new product or service.
