Solvency Ratios, also known as leverage ratios, are one of many ratios that can help you to assess the financial health of a business.
Solvency ratios measure a company’s ability to meet its long-term financial obligations. They do this by comparing a company’s level of debt against earnings, assets, and equity.
Solvency ratios are commonly used by lenders or investors to determine the ability of a company to pay back its debts.
The better your solvency ratio the more creditworthy and financially sound your company is.
Solvency Ratios vs. Liquidity Ratios
Many people get confused between solvency and liquidity ratios. Solvency ratios focus on a company’s ability to meet its long-term financial obligations. Liquidity ratios, on the other hand, focus on a company’s ability to meet its short-term financial obligations.
In simple terms, liquidity ratios deal with whether an organization can pay its immediate bills.
Types of Solvency Ratio
There are actually many different solvency ratios in use today, and we’ll cover the important ones below. But, there is one solvency ratio that is considered to be the key solvency ratio.
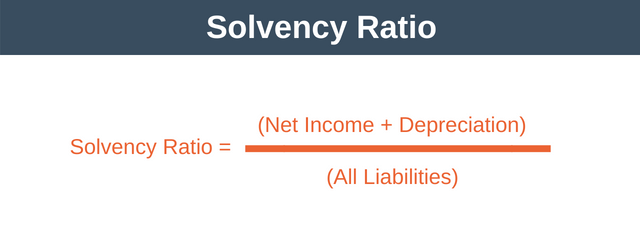
Let’s break this formula down to make sense of it.
- Net income: This is the company’s profit after tax. You can find this figure on the bottom line of your income statement. Which, by the way, is where the term “bottom line” comes from.
- Depreciation: This is the decrease in value of the company’s assets over time. By including depreciation in the formula we assess the long-term health of the company. This is because we take into account the need for the company to replace its assets over time.
- All liabilities: This is what it says, all long-term plus all short-term debts.
What is a Good Solvency Ratio?
What is considered a good solvency ratio will differ from industry to industry. However, generally, a solvency ratio of 20% and higher is considered to be good.
It can also be useful to calculate the solvency ratio of all your competitors. This will give you a better sense of how you are doing relative to your peers.
Solvency Ratio Example
Let’s look at a simple example to see how two hypothetical companies compare. We will assume that these two companies are competitors operating within the same industry.
| (in thousands) | Company 1 | Company 2 |
| Net Income | $2,000 | $9,000 |
| Depreciation | $1,600 | $6,500 |
| Net Income + Depreciation (A) | $3,600 | $15,500 |
| Short-term Liabilities | $1,200 | $12,000 |
| Long-term Liabilities | $13,000 | $6,000 |
| All Liabilities (B) | $14,200 | $18,000 |
| Solvency Ratio (A / B) | 25% | 86% |
As you can see in this solvency ratio example, we have two companies, 1 and 2. In thousands of dollars, Company 1 had a net income of $2,000 and Company 2 a net income of $9,000.
As you can see from the ratios at the bottom of the table, although Company 1 has a healthy solvency ratio at 25%, it’s competitor is far more healthy at 86%.
Caution: This is despite the fact that Company 2 has very high short-term liabilities relative to its net income. To detect this immediate risk to the solvency of Company 2 it would be better to look at liquidity ratios. Assuming Company 2 can roll over its short-term liabilities indefinitely then it appears to be in much better financial health than Company 1.
Other Solvency Ratios
We’ve covered the most important equity ratio to be aware of. However, there are others out there. The most important ones to be aware of are:
1. Debt to Equity Ratio
This solvency ratio shows the percentage of debt that comes from financing as opposed to investors. It is calculated as follows:
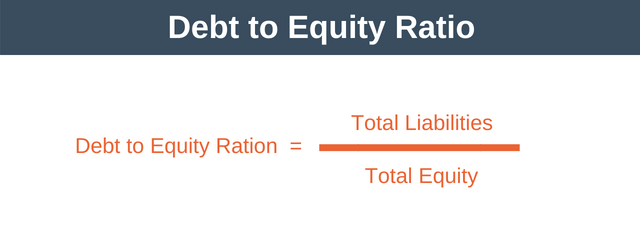
The higher the percentage the more debt is being relied on to fund the business.
2. Equity Ratio
This formula tells us how much of the total assets are owned outright by the investors after all debts are paid. If the company was closed down tomorrow this ratio shows how much shareholders would be entitled to after all liabilities have been paid.
The equity ratio formula is:
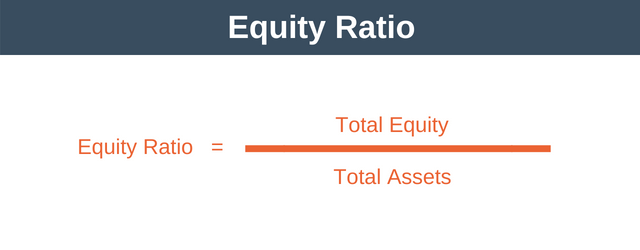
* Note that Total Equity is defined as total assets minus total liabilities.
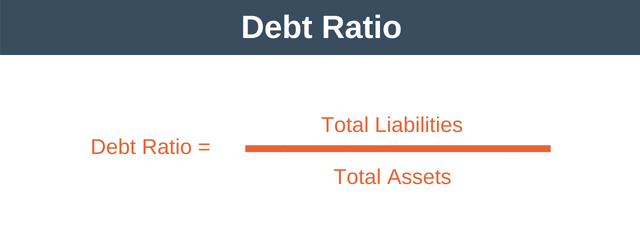
3. Debt Ratio
This formula tells us how much of its assets a company would have to sell to pay off all of its debts. The debt ratio is calculated as follows:
Solvency Ratio Disadvantages
There are a number of things to watch out for and be aware of when attempting to use the solvency ratio. These are:
Some earnings may not be repeatable.
For example, imagine if a company sold one of its premises during the financial year. The proceeds from this sale would appear as earnings. This would obviously skew the ratio to appear more favorable than the real situation. Because of this, operating income can be a better figure to use in the calculation, replacing net income.
Short-term liabilities can fluctuate massively from one month to the next.
For example, if the company paid the rent for its offices yearly as one lump sum, this would skew the result. It would skew the result favorably if you did the calculation based on a month where the rent wasn’t due. Because of this, it can be better to use a figure for short-term liabilities which is averaged over a number of months.
A low solvency ratio may not indicate that a company will eventually go bankrupt.
This is because it may be possible to roll-over (extend the term of) existing debt or convert it into equity, in a debt-to-equity swap. In a debt-to-equity swap, an outstanding loan gets turned into shares in the company.
Summary
Liquidity ratios provide a great way to determine if your company can remain solvent in the short-term. But it is solvency-ratios that provide a great way to check your long-term financial health. They help you identify potential financial concerns in advance before they become a major problem.
There are many different solvency ratios in existence. They are typically used by lenders to determine the creditworthiness of your business.


