A Gantt Chart is a type of horizontal bar chart which can be used to illustrate schedules. A Gantt chart shows the start and finish dates of the tasks that make up a project. If you’re managing a project, before you create your Gantt Chart you should have created your Work Breakdown Structure (WBS) to identify the tasks which that up the project. Once you have your WBS, your Gantt Chart should be laid out in accordance with it.
The horizontal axis of a Gantt Chart shows the timeline of the project. The granularity of this axis will change depending on the size and duration of project you’re considering. For small projects you could monitor by days, and for larger projects you could use weeks or even months. The vertical axis shows the tasks which make up the project. In large projects certain tasks may have their own Gantt Chart with their tasks broken down separately.
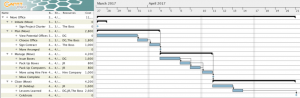
An simple example Gantt Chart is shown below:

In the diagram above you can see that we have three types of column, Tasks – listing the individual tasks that need to be done, Resource – showing who is performing each task, and Time – shown in daily increments for the month of March. You can see that we have one task per row, and you can infer the duration of each task by looking at the length of the blue bar against that task, task 1 being 4 days in duration, for example. Note that this plan has not been levelled (optimized) as Andy is double booked on day 4, having to do both Task 1 and Task 4.
In the real world your Gantt Chart will be much more complex than the one above. A good Gantt Chart tool will allow you to instantly see progress against each task, and understand the dependencies between tasks, amongst other features.
History
Gantt Charts are named after Henry Gantt who introduced them between 1910 and 1915. They may be considered a very standard project management tool today but at the time of their introduction they were ground-breaking. The introduction of personal computers in the 1980s lead to the widespread use of Gantt Charts for scheduling.
Gantt Chart Advantages
Hopefully by now you are beginning to see that the advantages of Gantt Charts include:
- Intelligibility: they allow you to reduce tasks and the timeline onto a single page. They allow us to understand how all tasks merge together to form the completed project. They also allow us to see exactly where we are in the project.
- Ease of Communication: because they show how everything fits together they are very useful in communicating project status.
- Efficiency: they allow us to move tasks around to generate the most optimal workload for individual team members, so team members are as productive as possible but not overloaded. This means that whilst one team waits on dependencies from another team they can still be productive, working on other tasks.
- Manageability: by being able to visualize the entire project in a Gantt Chart managers have increased understanding about the project and how the different components fit together. This enables them to better manage their projects as they have a better understanding of how decisions or trade-offs impact the overall schedule.
Gantt Chart Disadvantages
Despite Gantt Charts having many advantages, there are still some disadvantages:
- Usability: Larger Gantt Charts consisting of many tasks can be difficult to use – they don’t fit on a computer screen, and if printed will span multiple sheets of paper. Additionally, if there are many dependencies it can be difficult to see each dependency clearly.
- Meaning: Gantt Charts are great for understand how tasks fit together to form the whole project but they convey very little meaning about the tasks themselves.
- Magnitude Blindness: only the relative duration of elements is displayed in the chart, not their relative size, resulting in it being impossible to comprehend the magnitude to which you are ahead or behind schedule. For example, if one task is 2-days ahead of schedule and another is 2-days behind schedule, this does not mean that overall you are on schedule, because the Gantt Chart does not show you how many resources either task consumes.
Summary
In summary, a Gantt Chart is a method of illustrating schedules, which was first introduced around 1910. These days they are a standard component of every project manager’s toolkit, and are great for both seeing and sharing how tasks merge together to form the finished project. It is worth keeping in mind the disadvantages of Gantt Charts to get maximum value from their use.