Earned Value provides an objective method of measuring project performance and predicting the likely future outcome of a project. Program managers, project managers, and in fact, managers at all levels need to know some vital information about projects such as:
- How much work has been done?
- How much has it cost?
- What do we now estimate the likely final cost to be?
- When do we now estimate the planned work will be complete?
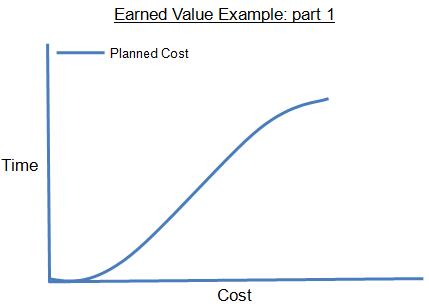
Earned Value analysis can throw light onto all of these questions. The diagram below shows how we might typically plan the costs incurred on a typical project:
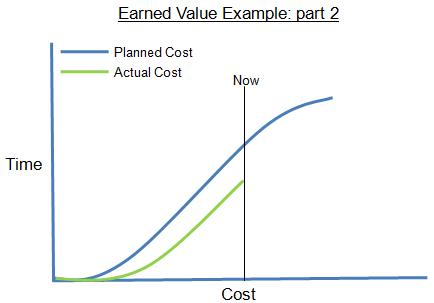
The above diagram shows our spending against our baseline plan. However, as I’m sure you’re aware, the best laid plans of mice and men, go oft awry – plans rarely go as we expect. If we were keeping track of the actual costs incurred as the project progressed, we might plot this against our planned expenditure as follows.
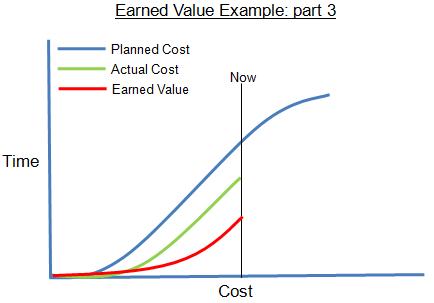
The vertical line shows the current point in time of the project. In the diagram above you can see that we are spending less than we planned to spend by this time. This looks like great news, but we actually don’t know how much work has been completed, so let’s dig a little deeper. This is where the concept of Earned Value comes in. You can think of earned value as being the cost of the completed work in terms of the budget originally assigned to that work. If we were to plot Earned Value onto our diagram we might end up with something that looks like the diagram below:
In last diagram we looked at, it seemed as though everything was going great, but now we can see that because the Earned Value line is below the Actual Cost line, we know that we’re spending more that we planned to achieve the work done to date, essentially, we’re running over budget. This is the true picture of what’s happening, and it’s the opposite of what we previously thought.
Worse, because Earned Value is below the Planned Cost, we know that the project is also running behind schedule. Again, this is something we couldn’t have understood before we had the Earned Value.
Tip: The best way to read and understand these Earned Value Management graphics is to first seek out the Earned Value line and compare it first with the Planned Cost line to understand schedule performance, and then the Actual Cost line for understand cost performance.
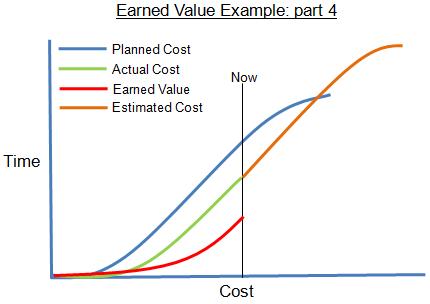
Going back to our example, the final piece of information we identified that managers need to know is an estimate of when the work will be completed and how much it is likely to cost. Again, earned value allows us to estimate these values. This works as we know how much work there is in total, and we know our current earned value (performance), so an estimate of duration and cost can be made. This is shown in the diagram below.
As you can see from the diagram above we are estimating that the project will not only cost more than we originally planned for, but it will take longer to complete than we originally scheduled.
Conclusion
Earned Value Analysis can really help in understand how a project is progressing against the original budget and time plan. It can also enable us to estimate when the project is likely to complete. The best way to read the Earned Value images is to first examine the Earned Value at a point in time and compare it to the Planned Cost to understand how you’re doing against the planned schedule, then compare it against the Actual Cost to understand how you’re doing against the planned budget. The real value of Earned Value Management is in providing early warning of deviance from schedule and/or cost.
