Pareto analysis is a problem solving and decision-making tool that can help you choose the appropriate course of action when many options are available, and there aren’t enough resources to pursue all options.
Imagine you are the Leader of a small startup. You have to make important decisions about how to invest your time and money. You want to invest wisely. How do you know which of your many ideas will lead your startup to the fastest growth?
In this situation, it would be useful to perform a Pareto analysis. Your Pareto analysis will help you prioritize which actions to take, by showing you which actions will bring the fastest growth to your business.
Note
Pareto analysis is known by several other names, including:
- The law of the vital few.
- The principle of factor sparsity.
- The Pareto principle.
- The 80/20 rule.
The Pareto Principle is named after Italian economist Vilfredo Pareto, who observed in the 19th century that 80% of outcomes come from 20% of causes.
Examples of the Pareto principle include that:
- 80% of results come from 20% of the work.
- 80% of the land is owned by 20% of the people.
- 80% of sales are attributed to 20% of customers.
- 80% of wealth belongs to 20% of the people.
When to use a Pareto Analysis?
Daily life requires us to make multiple decisions. Some of these decisions are easy to make because it’s obvious which course of action to take.
Other decisions are more complicated, particularly when we don’t have the resources to pursue all options. In this situation, using a Pareto analysis can give you the information you need to prioritize, so you make the best decision.
Factor Sparsity
The 80/20 rule seeks to identify which 20% of actions will realize 80% of outcomes, but it’s important to realize it works under a specific condition called factor sparsity.
Factor sparsity is simply another way of saying that you have limited resources.
For example, in business, you will typically have more opportunities than you have resources to pursue. When investing, you will have more investment opportunities than you have financial means.
These constraints on your resources (factor sparsity) mean you have to prioritize. It is in situations such as these, where factor sparsity is present, and the correct path to take isn’t clear that conducting a Pareto analysis can be useful.
Using the Pareto Analysis
To solve a problem using Pareto analysis, you can follow this five-step process.
Step 1: Identify and list all the problems.
Create a list of all your problems.
Step 2: Identify the root causes
Identify the root cause of each problem. By identifying the root cause it will help you direct your effort where it is most needed and prevent you from only superficially solving problems.
A 5 Whys analysis can be a useful tool to help you find the root cause of each problem.
Step 3: Score each of the options using some relative measure.
For example, you might use a scale like 1 to 10, where problems ranked 1 have the lowest impact, and those ranked 10 have the highest impact.
Step 4: Rank the items.
Now add up your total scores for each of the root causes you identified.
Step 5: Take action
Create a plan to address those root causes that are causing you the biggest problem.
Pareto Analysis Examples
Let’s take a moment to look at two examples of how to perform a Pareto analysis. This will help bring the 5-step process above to life.
Example One: Investigating IT Problems
In this example, imagine that you are the new manager of an IT department within a small firm. Your biggest problem is that your customer-facing server keeps crashing. When this happens, the company is generating zero revenue.
Obviously, it’s essential that this is rectified as soon as possible. Unfortunately, there are many reasons why the server keeps crashing. Because of this, you decide to perform a Pareto analysis to determine the order in which to fix issues.
Your first step is to get a list of reasons the server is crashing. These are shown below:
| Issue No. | Problem Description |
|---|---|
| 1. | Server configuration issue. |
| 2. | Credit cards fail to process correctly. |
| 3. | The server fails to connect to the payment gateway. |
| 4. | The server is overloaded. |
| 5. | Routine maintenance incorrectly performed. |
| 6. | Engineering doesn’t know the best sequence to investigate issues. |
Next, you will want to find the root cause for each incident. To do this, you use the 5 Whys technique and identify the following root causes.
| Issue No. | Problem Description | Root Cause |
|---|---|---|
| 1. | Server configuration issue. | Lack of processes. |
| 2. | Credit cards fail to process correctly. | The Payment system is out of date and requires updates. |
| 3. | The server fails to connect to the payment gateway. | The Payment system is out of date and needs updates. |
| 4. | The server is overloaded. | Old code is causing a problem. |
| 5. | Routine maintenance incorrectly performed | Lack of processes. |
| 6. | Engineering doesn’t know the best sequence to investigate issues. | Lack of processes. |
Next, you’ll want to score each row in some way. You decide to score each row from 1 to 10 based on how much negative impact this problem resulted in. 10 represents the most impact and 1 the least. This is shown below.
| Issue No. | Problem Description | Root Cause | Impact |
|---|---|---|---|
| 1. | Server configuration issue. | Lack of processes. | 7 |
| 2. | Credit cards fail to process correctly. | The Payment system is out of date and requires updates. | 2 |
| 3. | The server fails to connect to the payment gateway. | The Payment system is out of date and needs updates. | 5 |
| 4. | The server is overloaded. | Old code is causing a problem. | 3 |
| 5. | Routine maintenance incorrectly performed | Lack of processes. | 6 |
| 6. | Engineering doesn’t know the best sequence to investigate issues. | Lack of processes. | 9 |
The next step is to add the scores together for each of the root causes. This results in a table that looks like this.
| Root Cause | Impact |
|---|---|
| Lack of processes. | 22 |
| The Payment system is out of date and requires updates. | 7 |
| Old code is causing a problem. | 3 |
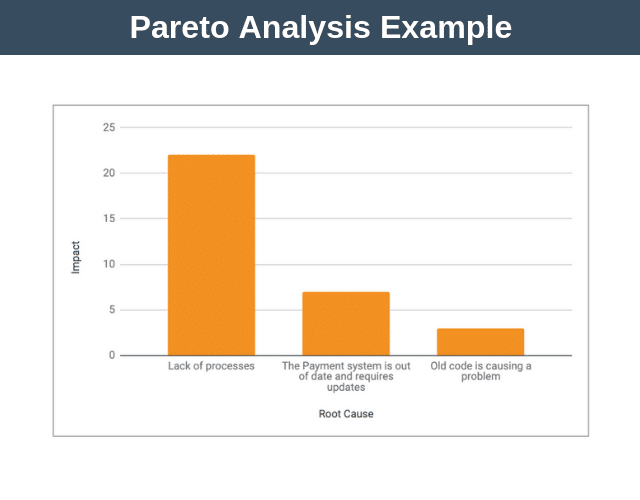
As you can see, the obvious first step in addressing your server problems is actually to invest in more robust processes and possibly some employee training to ensure that everyone knows how to follow those processes. By addressing this root cause first, you’ll be addressing 55% of your negative impact.
Representing your analysis as a bar chart you can clearly see that improved processes and training will have the biggest impact on the problem.
Example Two: Creating a Study Plan
If the previous example was quite complicated, this example is very simple. Remember that 80% of the results come from 20% of the efforts? Well, this is the reason why in this example we’ll just perform a rough and ready mentally calculated Pareto analysis – because it will give you 80% of the results for 20% of the effort.
In this scenario, you are a student. You have an exam tomorrow morning, and so far you have not studied at all. You don’t have enough time to revise everything. How do you decide which elements to study first?
You guessed it! You’re going to use a Pareto analysis.
You will perform your Pareto analysis by comparing the last three years of exam papers and ranking the most common topics. You will now revise for your exam in order of how likely a topic is to appear in your exam tomorrow.
Now, this approach might not result in you achieving an A grade, but it will give you the best possible grade given the very limited time you have available to study.
Advantages & Disadvantages
There are several advantages and disadvantages to a Pareto analysis which you should know about.
Advantages
- It can help decision-makers rank and understand which options to pursue when resources are limited.
- A useful tool to help visualize the root causes of a problem and take action.
- Prioritizes specific measures to ensure maximal benefit in an organization.
Disadvantages
- The methodology provides no guidance on how to find the root causes of problems.
- The 80/20 rule is a principle only and not an immutable law. In practice, you might find the 40% of the causes result in 60% of the results, for example.
- Data inputs to the Pareto analysis capture a snapshot in time, not what’s happening in real-time. This lagging effect can result in choices that impact the quality of your decision-making.
Pareto Analysis Summary
Sometimes we need a tool to help us with our decision-making to ensure we are applying effort in the most useful way.
Pareto analysis can be used to help you identify the appropriate course of action to take when resources are limited but there are many options available.


