Using a fishbone diagram can help an organization find the root causes of a problem.
No matter what line of work you are in, sometimes things go wrong. Some things that go wrong will be obvious and easy to resolve while others will be more complex. When complex problems occur, a fishbone diagram can help you to think about and categorize all of the different factors that may have led to the issue.
By doing this analysis you’re more likely to find the root cause of the problem, rather than jumping into an immediate solution which may later turn out to be incorrect. In this way, you become much more likely to permanently resolve the problem the first time.
Fishbone diagrams were originally designed to control quality in manufacturing processes, but they can also be used to find the root cause of a problem or improve a process experiencing issues.
The Fishbone Diagram
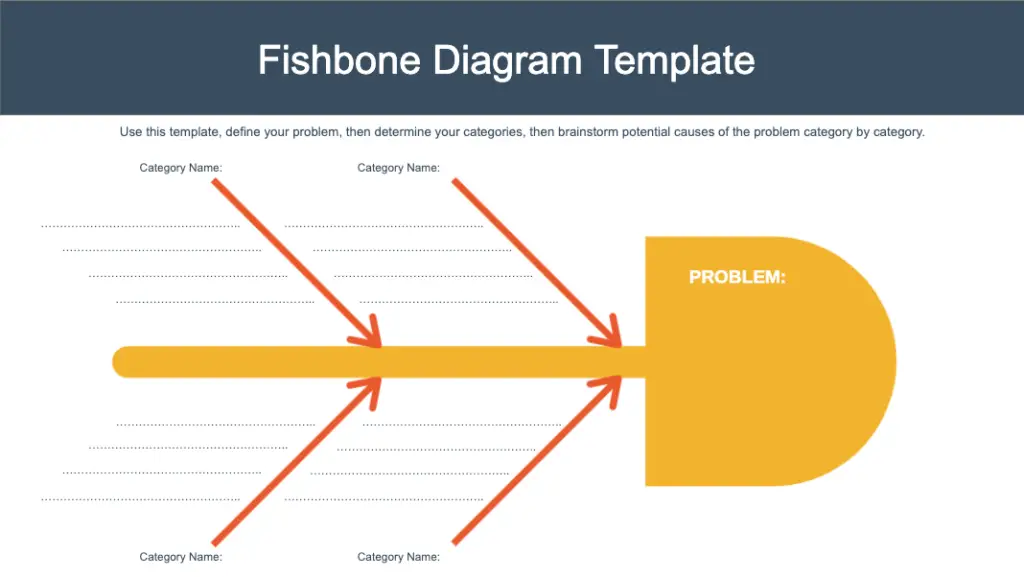
A Fishbone Diagram takes its name from the fact it resembles the shape of a fish skeleton. The head of the fishbone diagram represents the problem that you want to investigate. The backbone of the skeleton connects the spines, which represent the range of likely causes. Related causes are bundled together into categories.

The most common way to create a fishbone diagram is to brainstorm the causes that lead to the problem with your team. When doing this, the categories can be useful as they focus the discussion on a particular group of causes, rather than trying to consider all possible factors at once.
You can have any categories you like. In manufacturing, it is common to use the 5 Ms as categories: man, machine, material, method, and measurement. In service industries, it is common to use the 4 Ss: surrounding, suppliers, systems, and skill.
Background
The fishbone diagram is also known by several other names which can all be used interchangeably:
- Cause-and-effect diagram.
- Ishikawa diagram.
- Herringbone diagram.
The fishbone diagram was created by Japanese organizational theorist, Kaoru Ishikawa, a professor of engineering at the University of Tokyo, who was known for innovations in quality management.
Ishikawa pioneered the tool during the 1960s in the Kawasaki Shipyards.
Fishbone Diagram Example
For this example, suppose you run a business selling products online and your website unexpectedly crashes.
As the website has crashed your first priority will be to get the website going again as soon as possible. Once this is done, you decide to use a fishbone diagram to perform a deeper analysis of what caused the website to crash, so that you can prevent the same problem from happening again.
To do this you get the key members of your team together, along with a fishbone template, and brainstorm the potential reasons the website crashed.
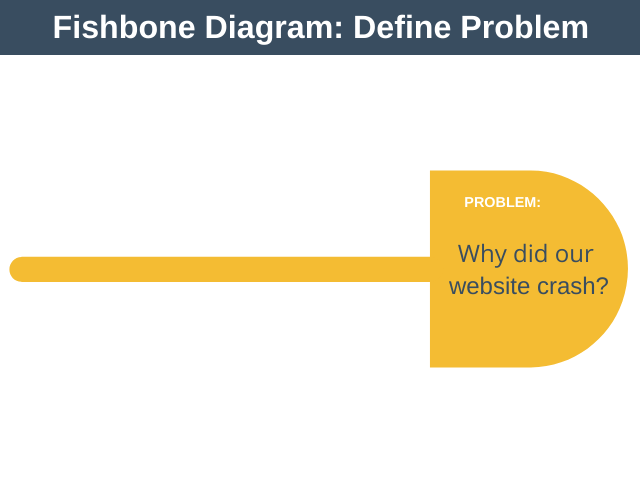
Step 1: State the Problem
The first step in the process is to state the problem you wish to remedy. This is usually done in the form of a question. So for our example, it will be, “Why did our website crash?”, and we update the fishbone template to reflect this.
Step 2: Define your Categories
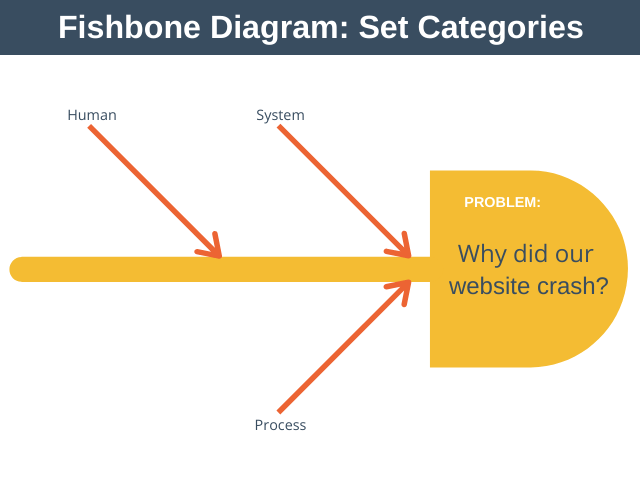
The next step is to define the categories you’ll use to guide the brainstorming. These don’t need to be set in stone and you can always create new categories or remove categories later as the brainstorming session causes your thinking to evolve.
For our example we decide to use the following categories:
- System: to capture causes associated with the system itself.
- Process: to capture any process issues that might have caused the website to crash.
- Human: to capture any potential human errors that may have caused the website to crash.
Once you’ve defined your initial set of categories you place them onto the template.
Note that there is no limit to the number of categories you can have.
Step 3: Brainstorm each Category
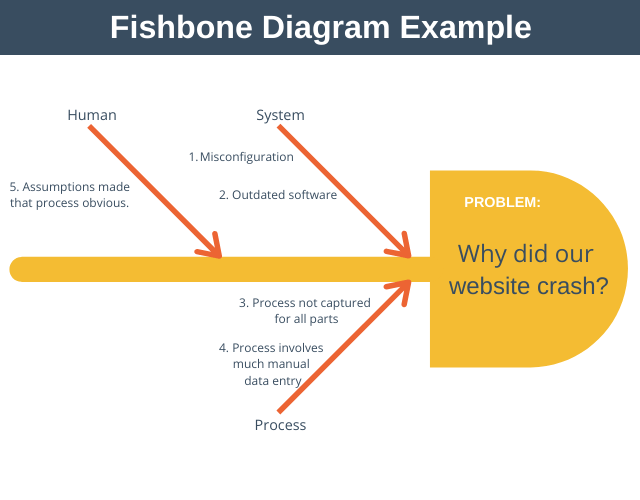
The next step is to brainstorm likely causes a category at a time.
As you brainstorm with your team you generate a list of top-level ideas. It can be useful to dig deeper into each of these ideas (potential causes) using a technique called the 5 Whys.
The purpose of the 5 Whys technique is to help you ensure you have uncovered the true root cause rather than a superficial cause. The technique is simple and works by asking why five times. An example of the 5 Whys is:
- Initial Cause: The website crashed because it ran out of memory.
- Why? Because it was incorrectly configured.
- Why? Because the site admin made a mistake.
- Why? Because development hadn’t provided adequate instructions.
- Why? Because they assumed it was obvious.
In this example, we can see that we asked why four times and were then not able to delve any deeper. Notice that by using the 5 Whys we shifted our thinking that the website crashed because it ran out of memory to realize that it may have been a human error – an engineer assumed something was obvious.
As you brainstorm all causes category by category you update your fishbone template.
Step 4: Analyze your Results
At this stage of the example, you have a fishbone template showing all of the possible causes of the problem. Now you need to evaluate and prioritize each of these causes so that you can take appropriate action to fix the problem.
One way to analyze your results is to ask the following questions:
- How likely is this cause to be the primary source of the problem?
- How easy would it be to fix this cause?
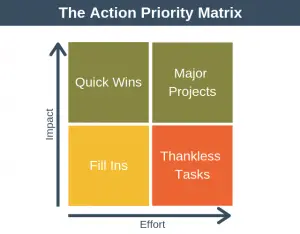
If a cause is very likely to be the source of the problem and it is easy to fix, then you’ll probably just get on and fix it. If the cause is very likely to be the source of the problem but is difficult to fix, then you will need to plan the fix as a project and prioritize it against the other priorities of the organization.
Often you may find that you have multiple likely causes of your problem. In this case, immediately address the low hanging fruit (those likely to resolve the problem and easy to fix) and plan and prioritize the more complex fixes against other work the organization needs to perform.
Fishbone Diagram Template
If you’d like to perform your own fishbone analysis then you can download a PDF copy of our fishbone analysis template here.
Advantages and Disadvantages
There are a number of advantages and disadvantages associated with fishbone diagrams.
Advantages
- Being a visual tool, it is easy to understand and shows clearly the relationship between cause and effect.
- It helps you find the most likely cause of the problem.
- You can apply the diagram to a range of problems.
- By involving the whole team in the creation of the Ishikawa diagram the whole team better understands the issues surrounding the problem.
Disadvantages
- The fishbone diagram itself doesn’t help you to prioritize causes. All causes are equally weighted in the diagram and you have to prioritize them yourself.
- Brainstorming is often reliant on opinion rather than fact. The output from the diagram is only as good as your brainstorming session.
- The diagram is less useful for complex causal relationships and can become unwieldy to use.
- You may waste time discussing causes that have very little impact on the problem.
Summary
The Fishbone diagram (Ishikawa diagram) was developed in the 1960s and provides a visual way to find the causes of a problem. It can be used in any industry and for many purposes, including identifying manufacturing defects and process improvement. The process of creating an Ishikawa diagram can also help create a shared understanding of the problem amongst your team members.
